WorkInConfidence’s Understand & Learn module produces a comprehensive package of reporting options to ensure that you can make the most of the surveys that you create and deploy.
Survey Progress Overview
Selecting Dashboard from the left-hand function menu will take you to a page that will give you a snapshot of all running surveys of all types at the bottom. This includes the number of responses that have been received today and in total.
From here you can press the “View all …” button to drill down to a list of all surveys and get further reporting options. See below for more details.
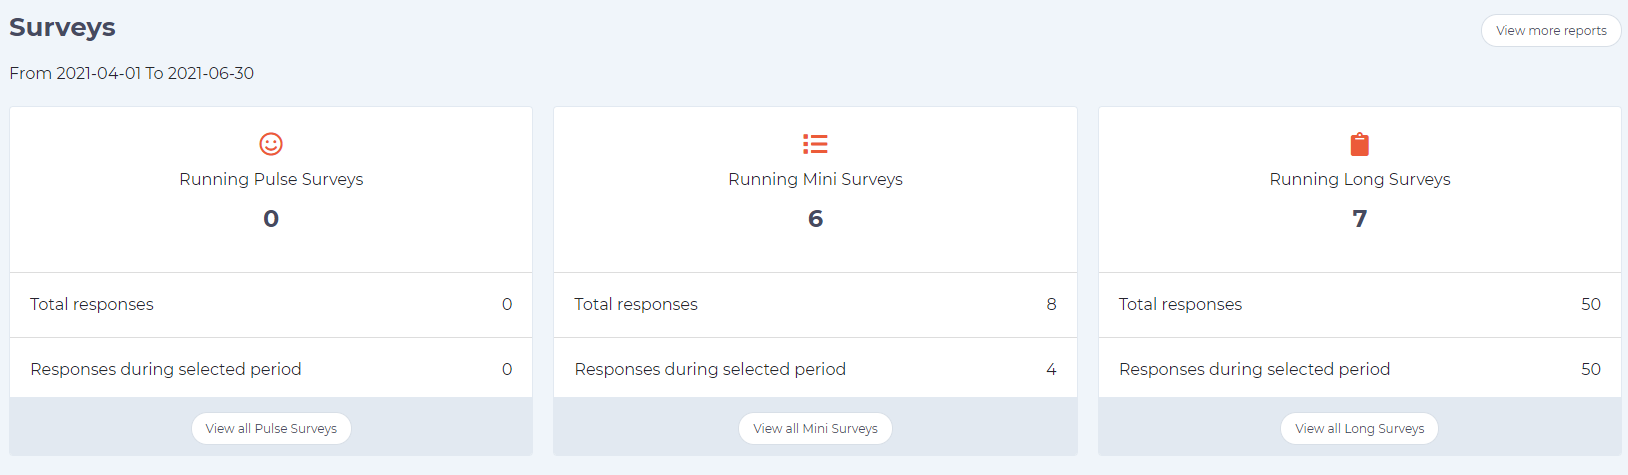
Dashboard showing overview of all survey types
Reports
Reports can be accessed from the Reports option on the left-hand side menu for those that have the Run Report Admin role assigned to them.
Standard Reports Option
Understand & Learn reports can also be accessed from the standard reports option found in the left hand function menu. Here you will find three folders with smiley faces that will allow you to access the reports for all surveys that you have access to. Click the run report button as usual to access the report.
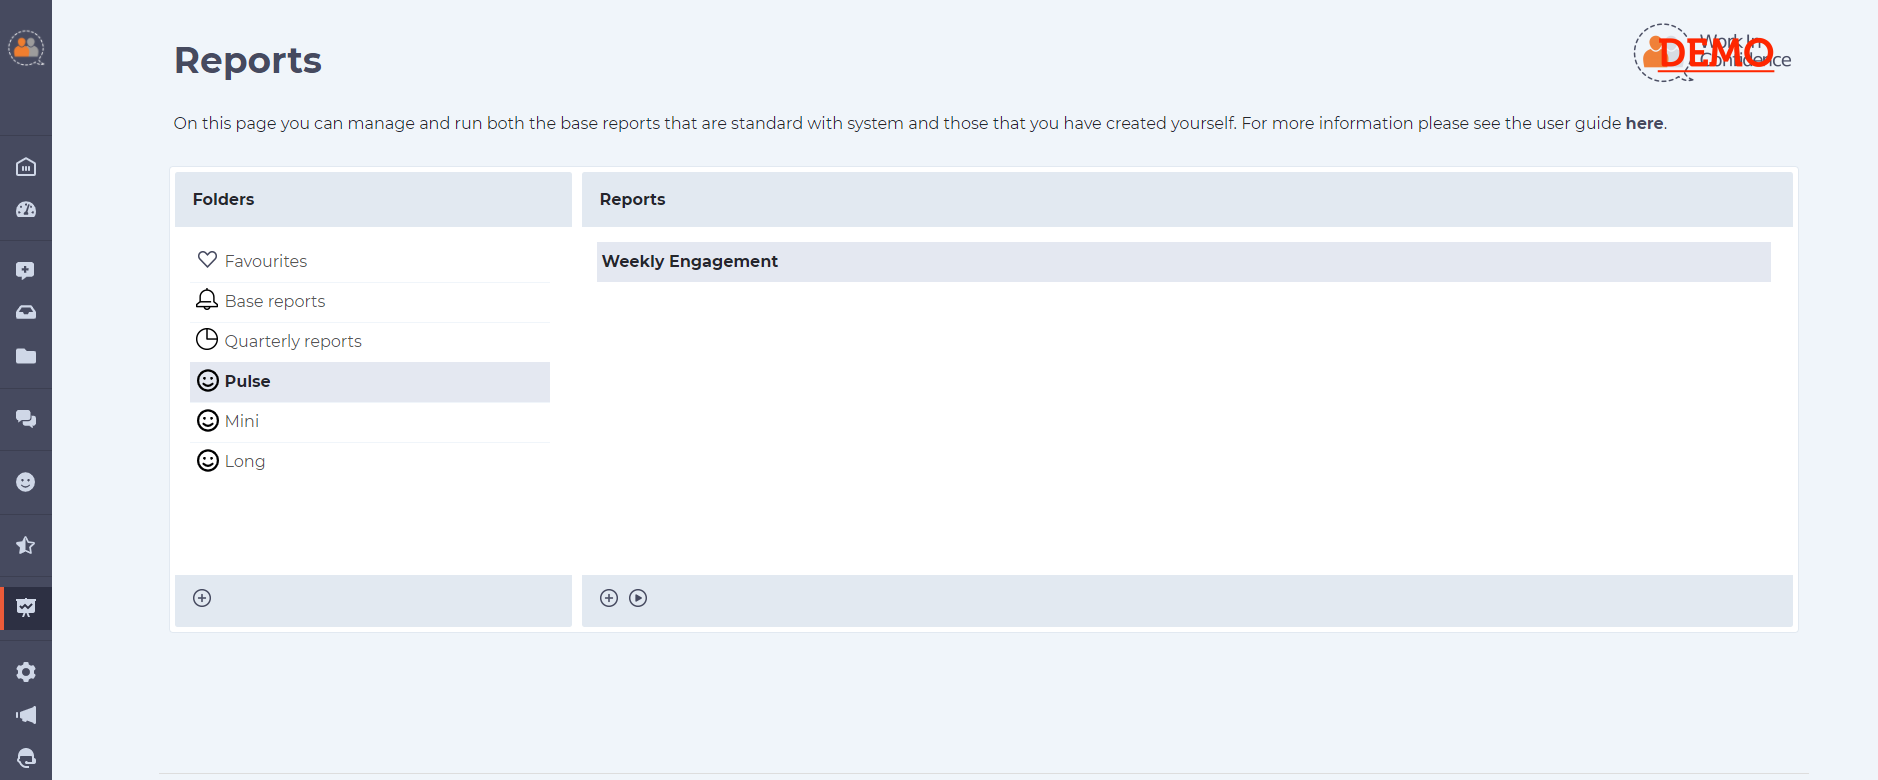
Accessing Survey Reports from the Reports button
Reporting
The Understand & Learn reporting page is broken down into four distinct areas: summary, graph, responses and filter. These are all discussed in greater detail below the image.
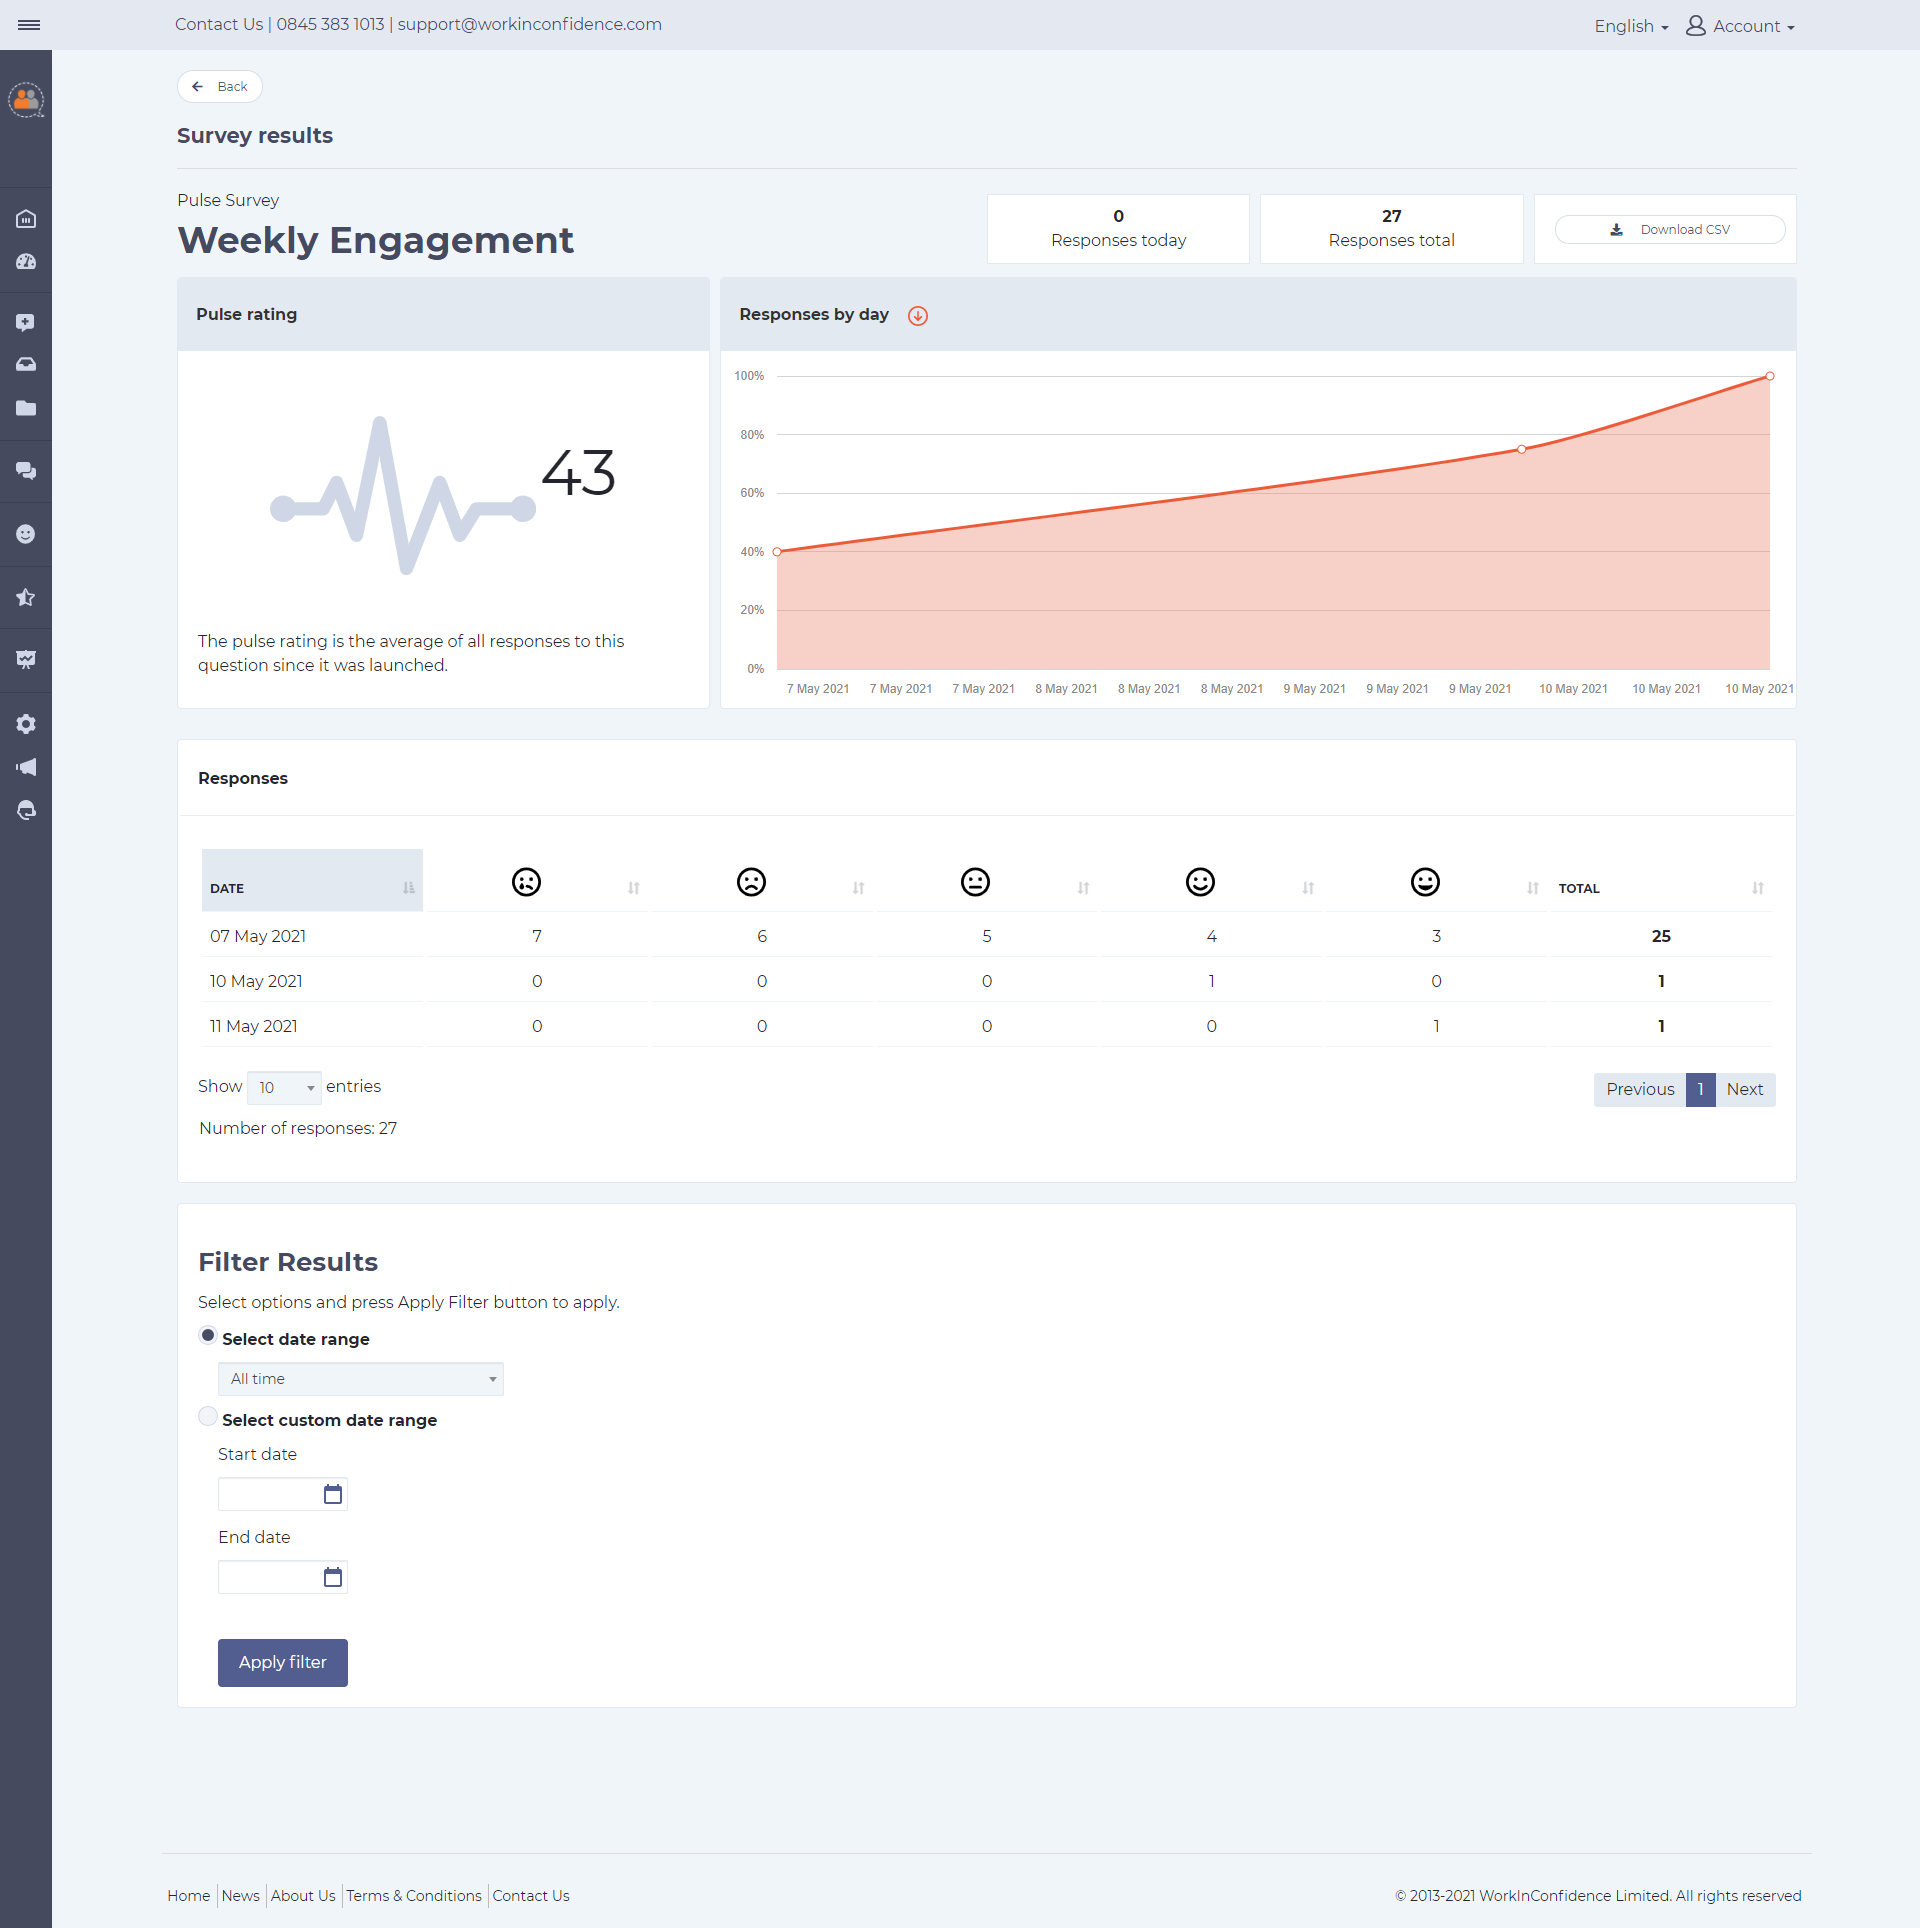
Example Survey Report Page
Summary
The summary area contains the following:
- the internal reference of the survey
- the number of responses received today
- the total number of responses over the life of this survey
- a button that allows you to download the results as a CSV file for analysis elsewhere.
Graphs
Depending on the type of survey you have created the survey results will be presented differently according to that type.
Pulse Surveys
The graph section shows the average of all responses to this question since it was launched along with the change over time.
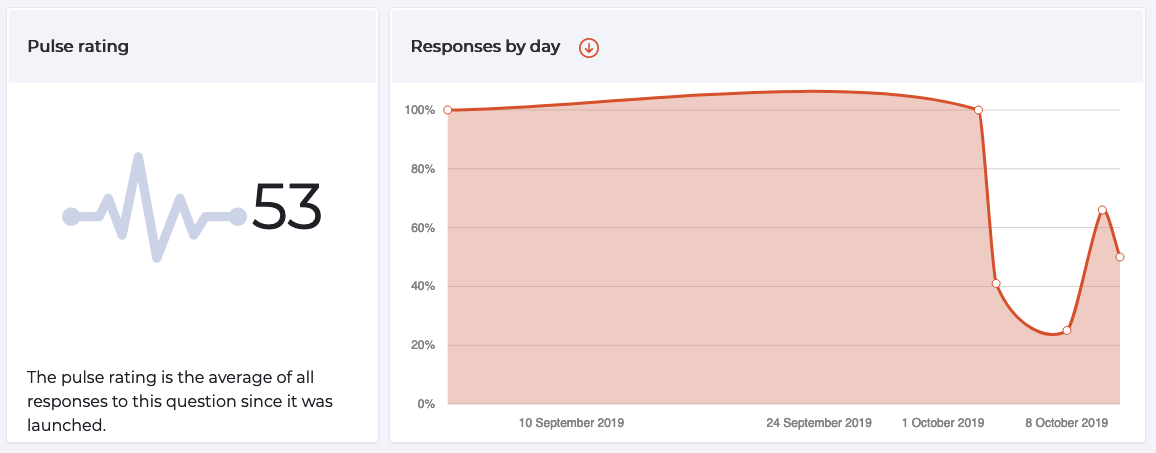
Pulse Survey Results
Mini Surveys
For Mini surveys results are shown in the order that the questions were presented to the responding user. For example the images below show pick list results and then the results from an eleven point scale question.
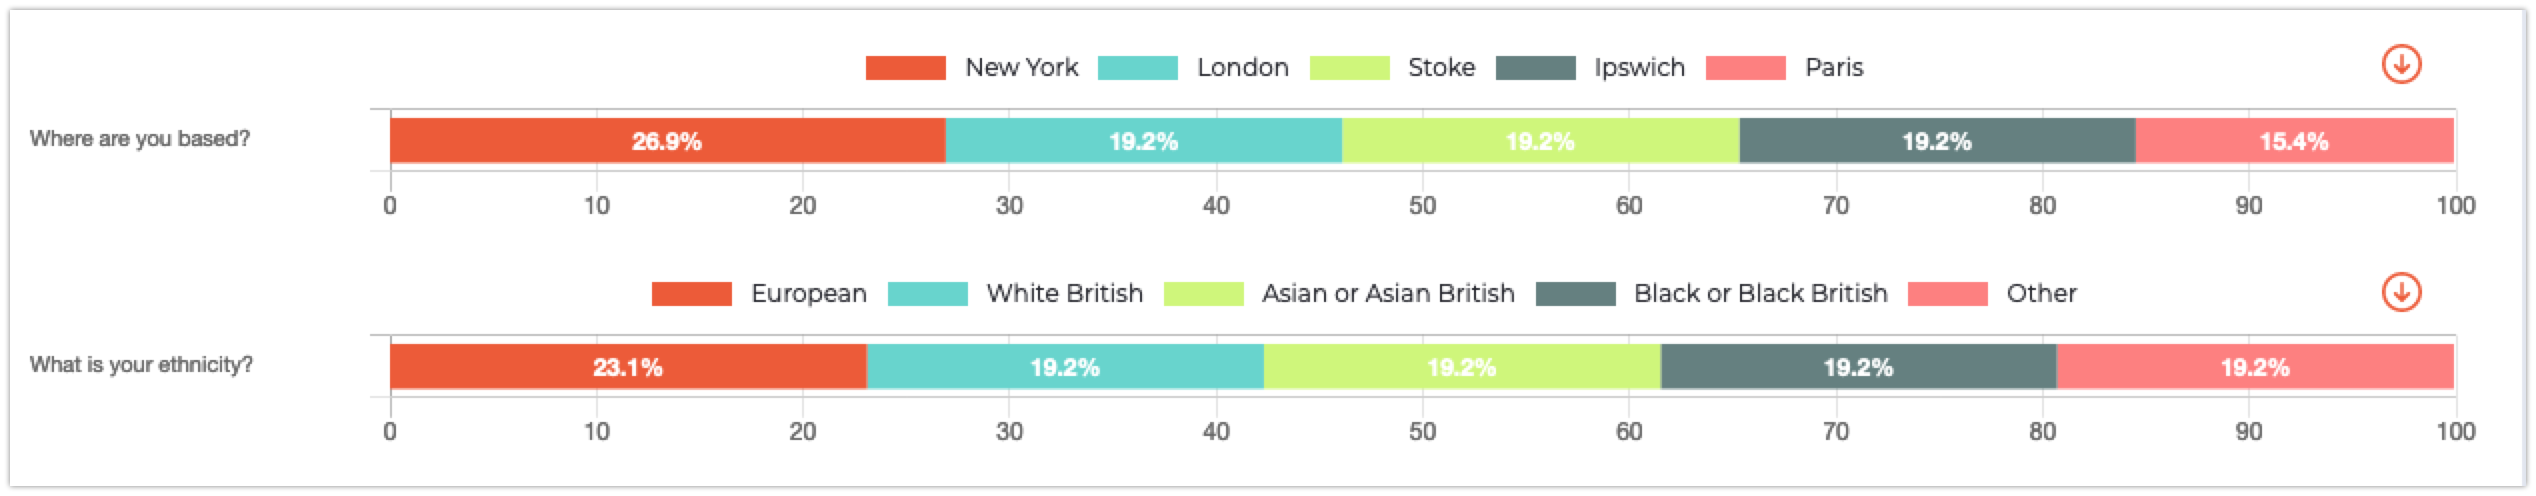
Mini Survey Pick List Results
Mini Survey Rating Results
Long Surveys
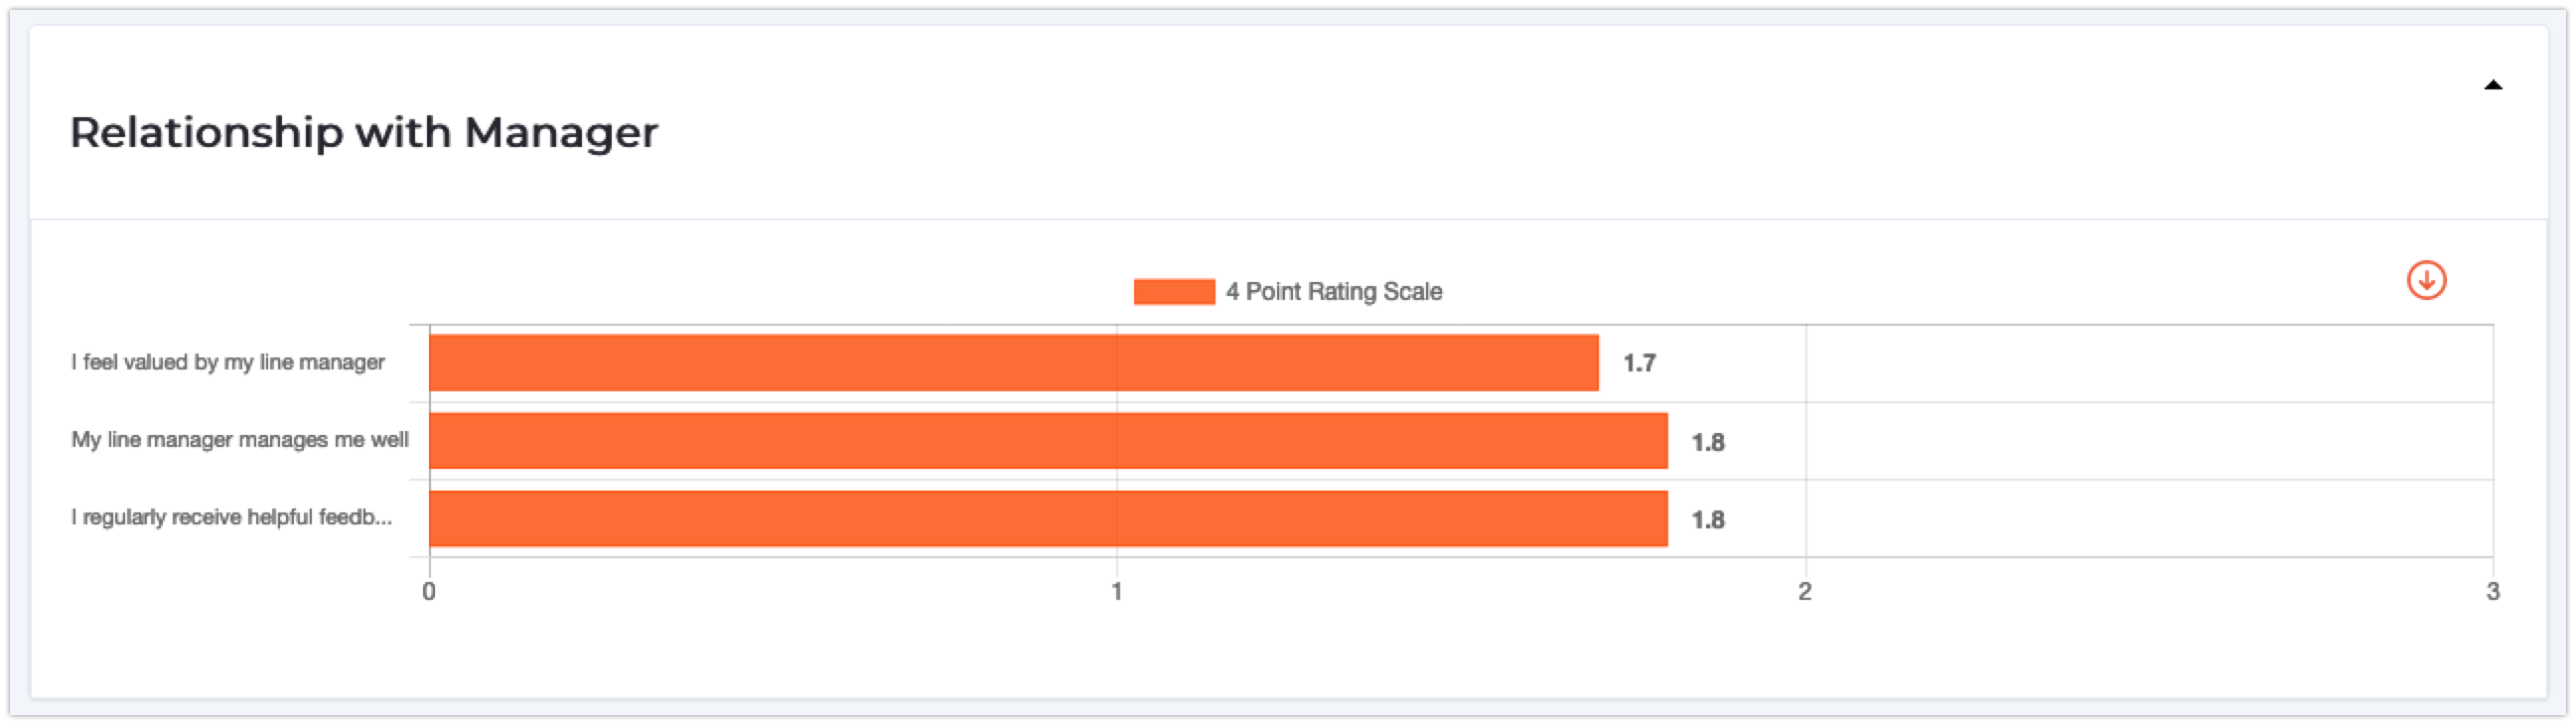
Results for Long surveys are broken down into the sections that the questions originally appeared. For example the images below show pick list results and then the results from three four point scale questions.
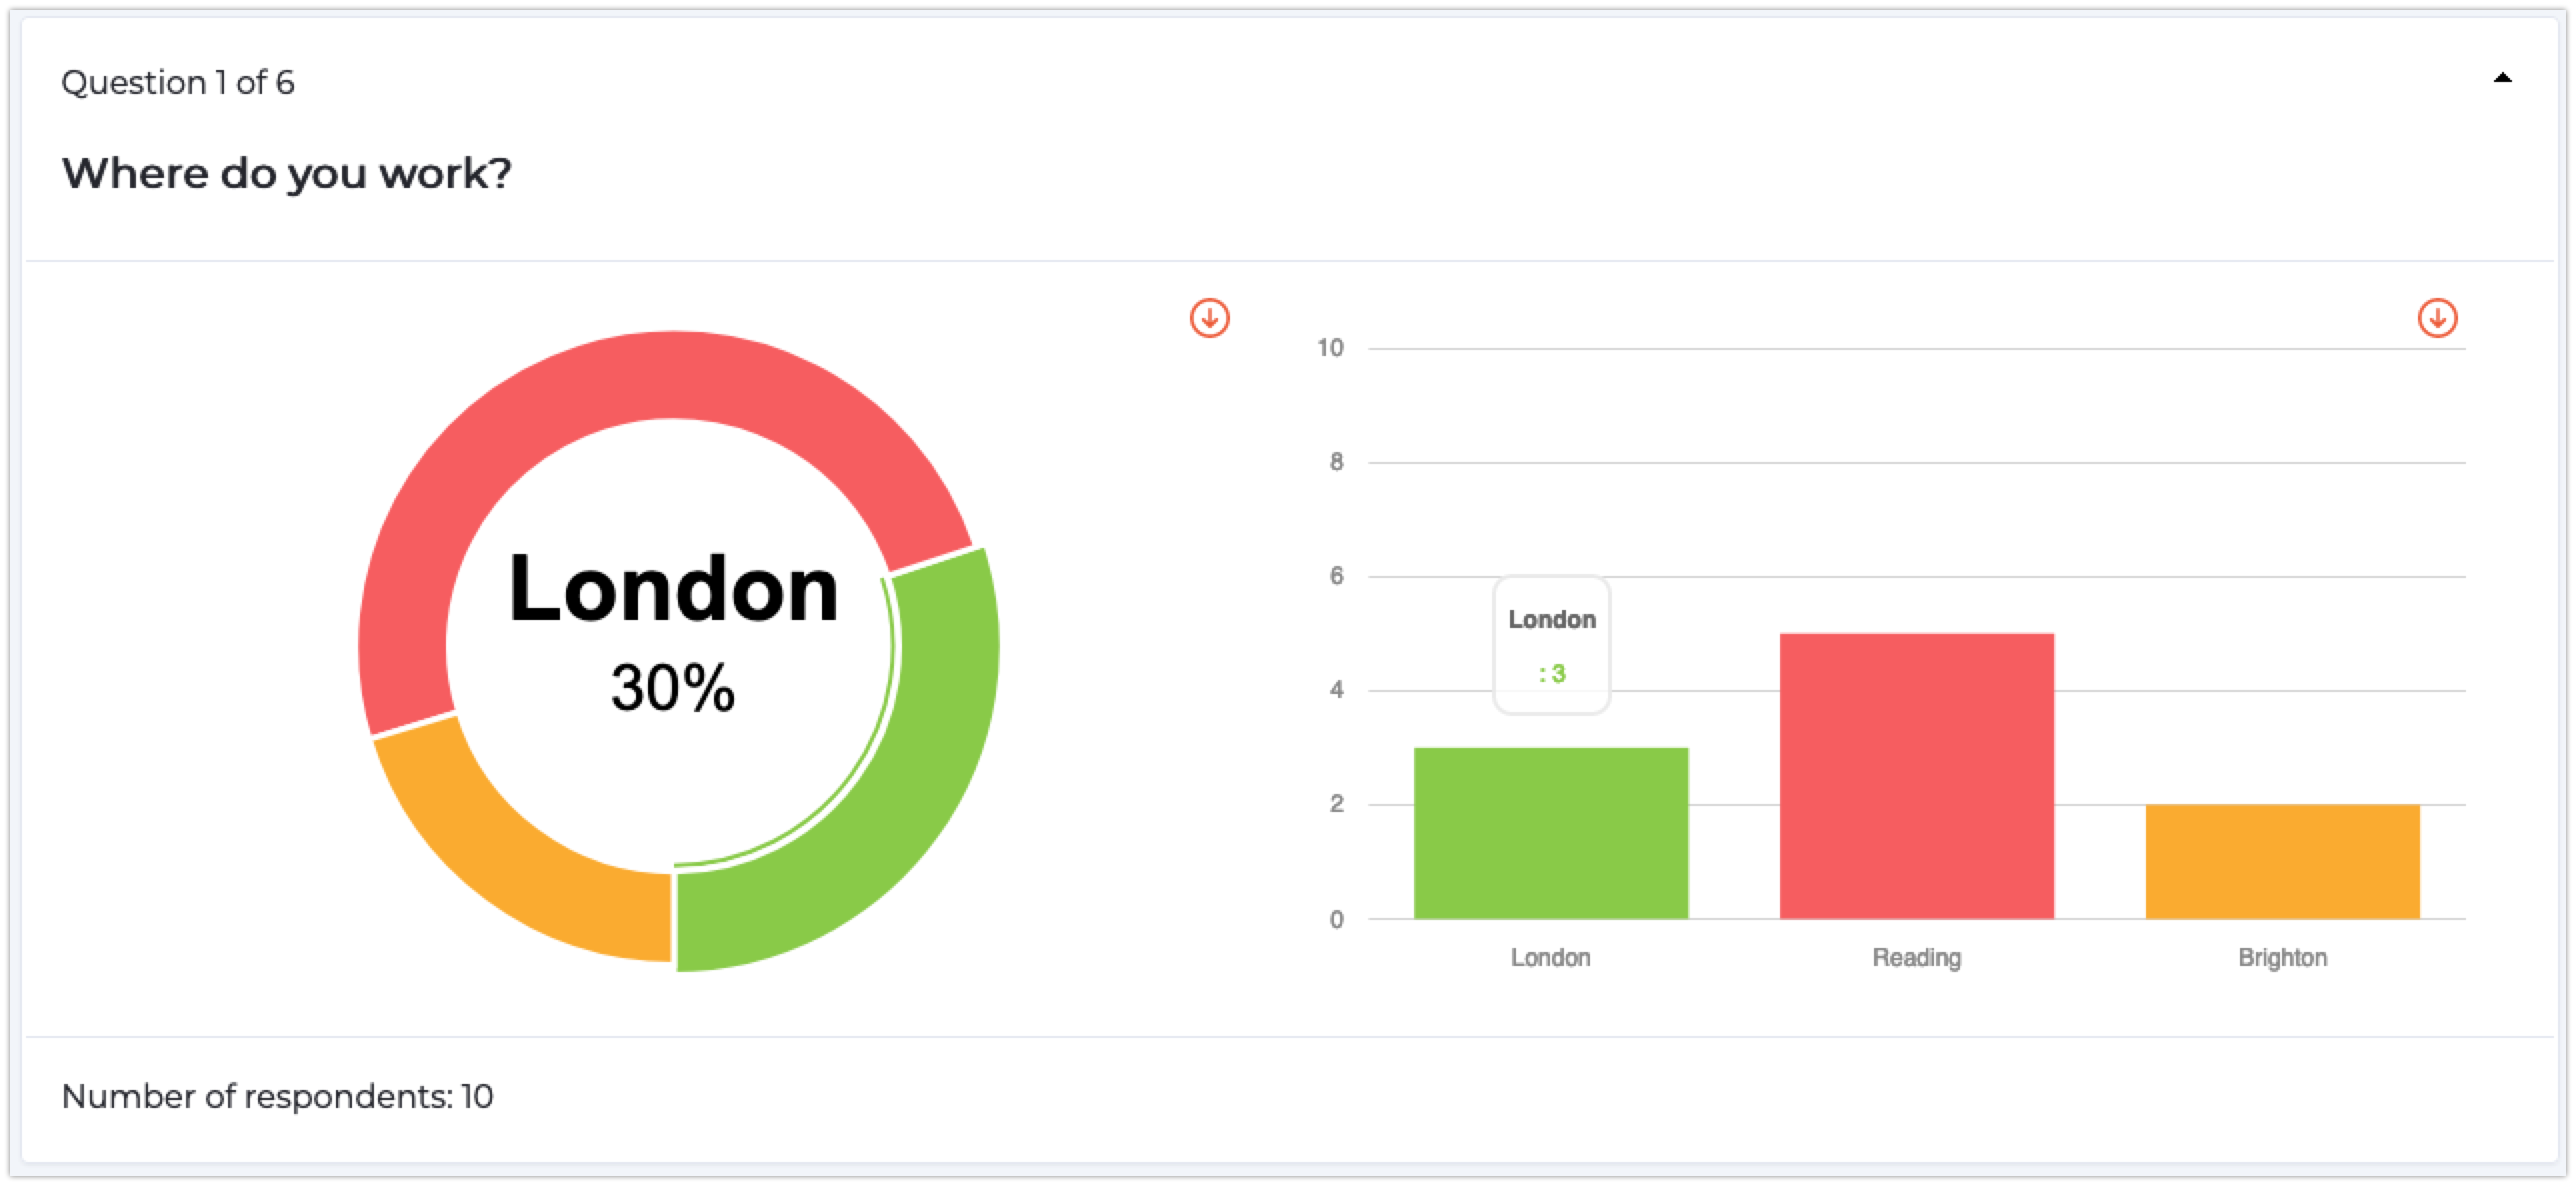
Pick List Results
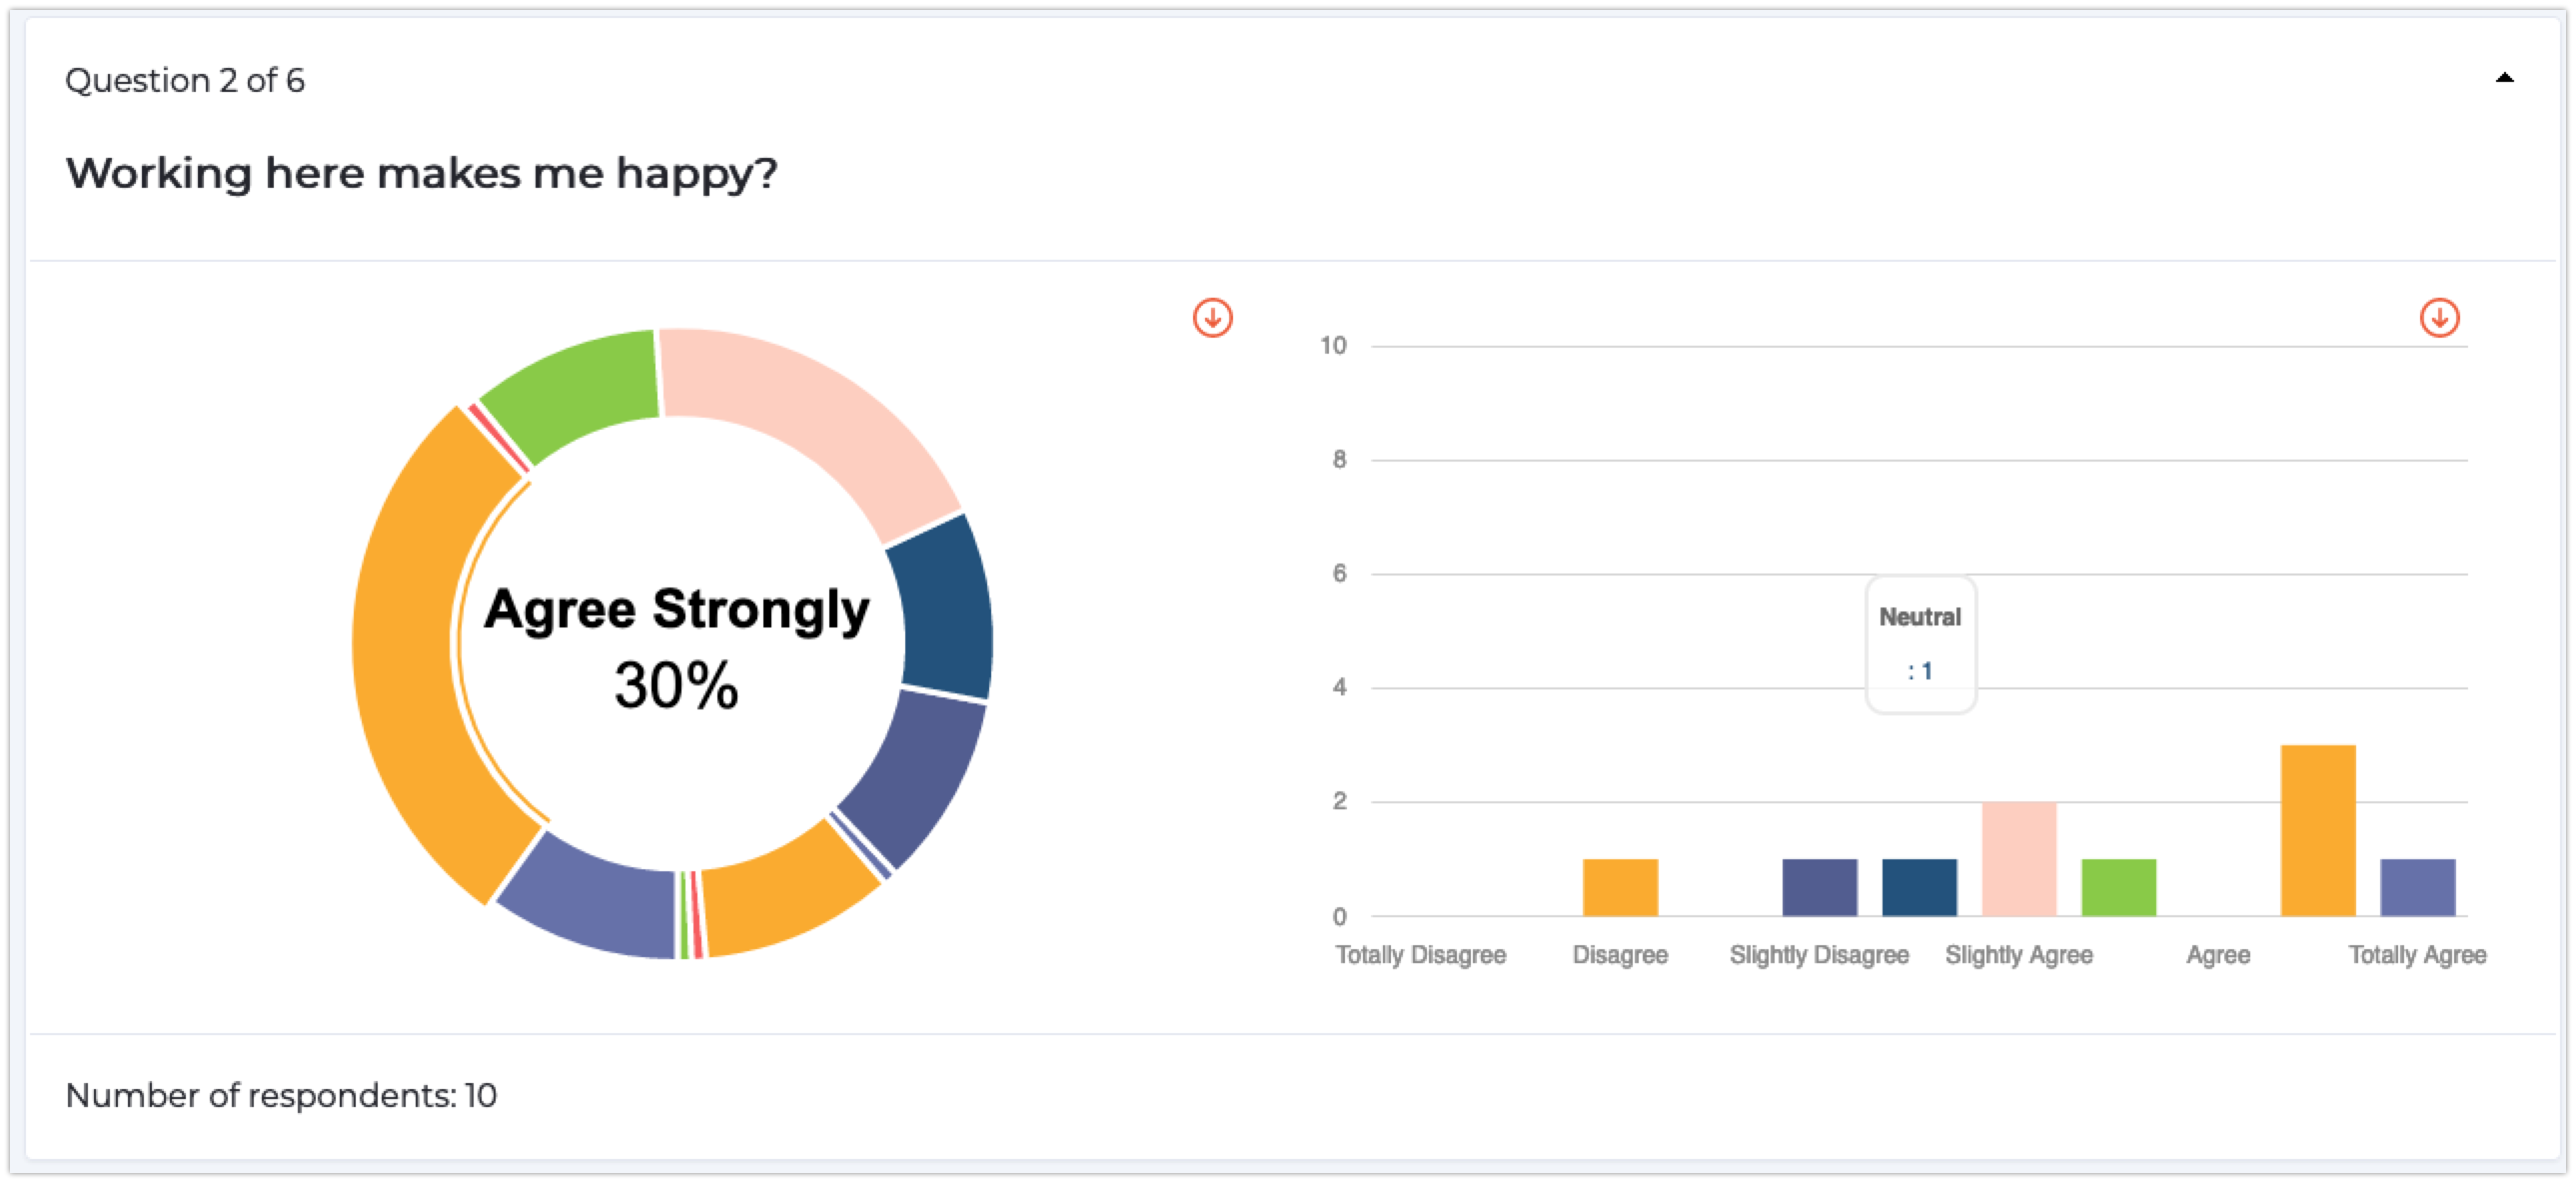
Scale Survey Results
Responses
In this section each question has its own panel with a break down of the number of responses shown graphically along with the text from any free text responses.
Filtering
The final section allows you to filter the data shown above by both pre-selected and custom date ranges and any pick lists that were created as part of the survey. This allows you to see, for example, all responses from a particular location made in the last month.
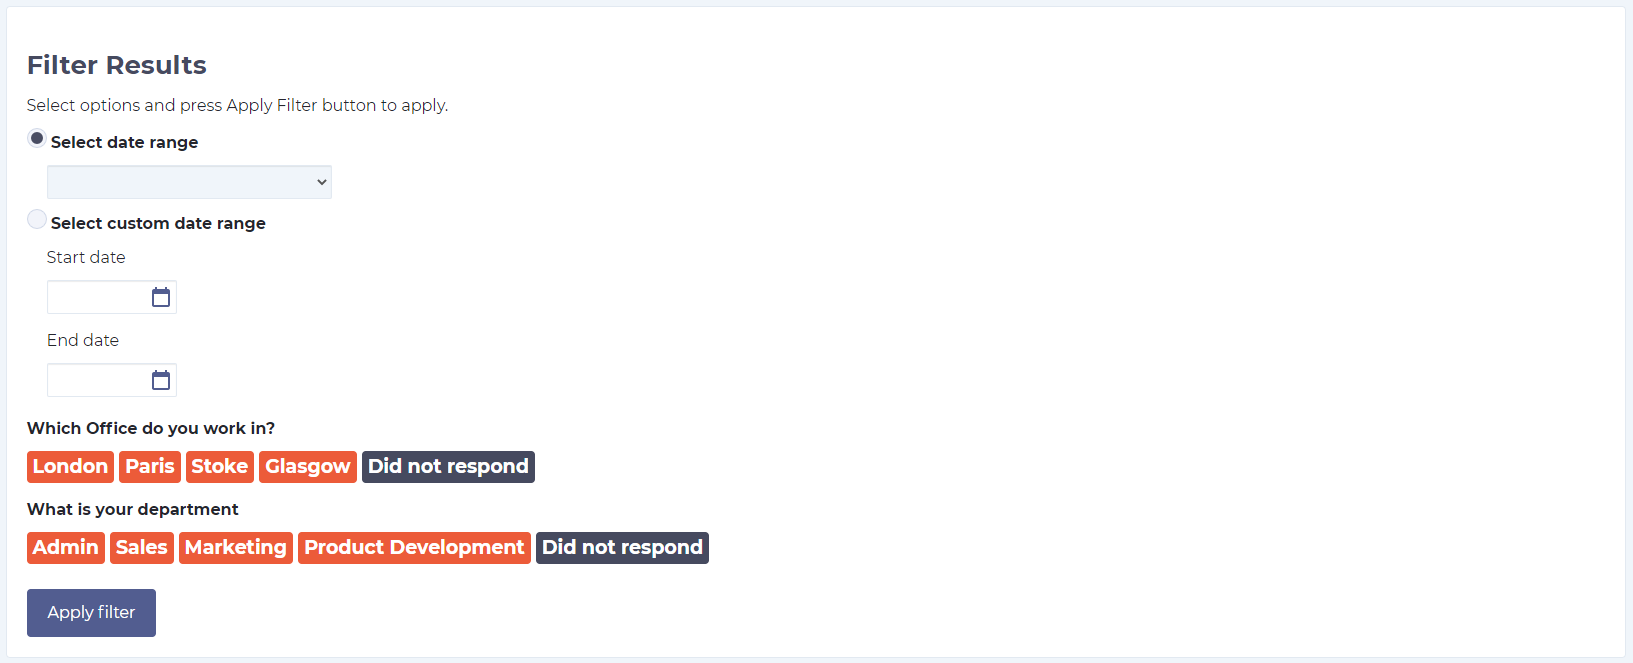
Example Survey Report Filters
Need more help? If you'd like help or support on any feature of WorkInConfidence then please get in touch by either creating a new support ticket, sending an email to [email protected] or using the chat function in the bottom right of the page.


 for Conversation Recipients (Managers) of WorkInConfidence")
